The browser console is one of the most powerful yet often underestimated tools available to web developers. Hidden inside browser developer tools, it provides deep insight into how a website behaves, surfaces errors and warnings, and allows direct interaction with running code. Once you understand its full potential, the console becomes an essential companion for debugging, testing, and performance analysis.
This guide explains how the browser console works, how developers can use it efficiently, and how it fits into modern development workflows when building and maintaining complex websites.
What the browser console actually does
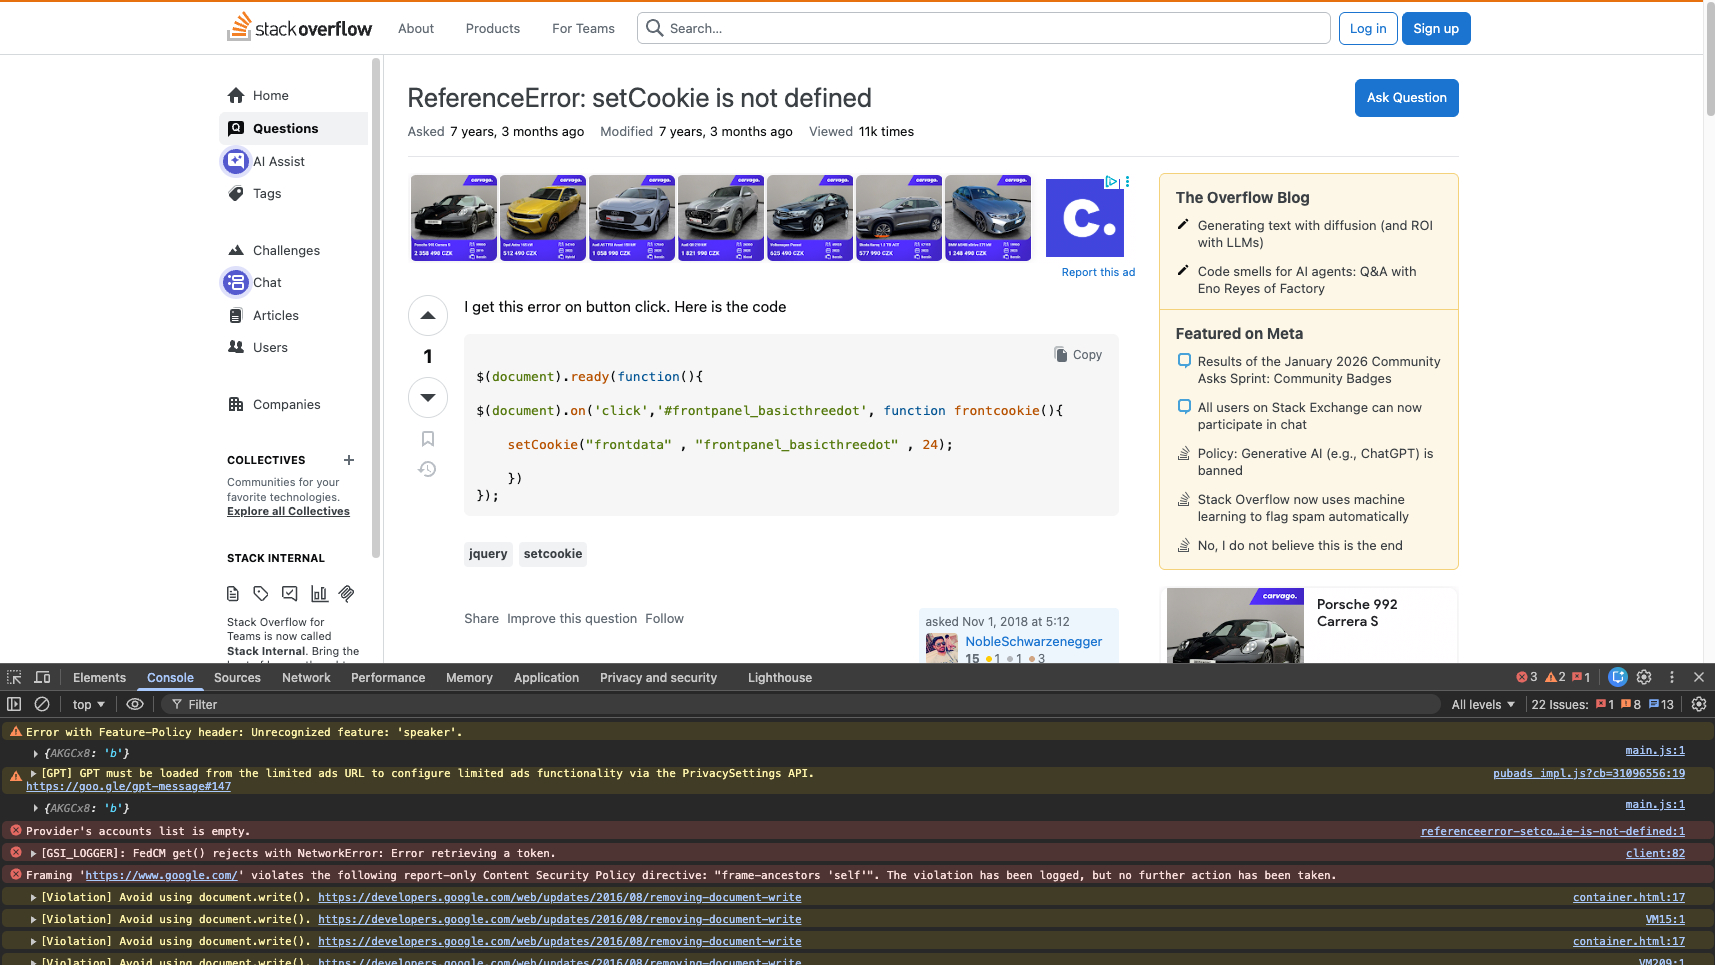
The browser console is a developer-facing interface that displays messages related to the currently loaded page. These messages include JavaScript errors, warnings, informational logs, and browser-generated diagnostics. Importantly, these logs are invisible to regular users and exist purely to support development and debugging.
Beyond passive logging, the console also acts as an interactive environment where developers can execute JavaScript directly on the page. This read-eval-print loop allows instant inspection of variables, manipulation of the DOM, and testing of code snippets without changing the source files.
The console is both a reporting tool and a live execution environment, making it invaluable during active development.
Opening and navigating the console
In Chrome and most Chromium-based browsers, the console is accessed through the developer tools interface. Developers can open it as a dedicated tab or as a drawer layered over other panels. This flexibility makes it easy to inspect logs while simultaneously reviewing elements, network activity, or performance data.
Once open, the console automatically streams messages generated by the page, providing immediate feedback whenever something goes wrong or behaves unexpectedly.
Understanding errors and warnings
Console messages come from many sources. JavaScript code may explicitly log information, while the browser itself reports failed network requests, deprecated APIs, accessibility concerns, or performance issues. Each message can be expanded to reveal a call stack showing exactly where the issue originated.
This stack trace allows developers to trace execution paths and quickly jump to the relevant source code. Modern browsers also provide contextual hints and explanations to speed up debugging.
Filtering and searching console output
On complex pages, console output can become overwhelming. Built-in filtering tools allow developers to search for specific text or restrict visible messages to certain severity levels such as errors or warnings.
A dedicated sidebar further breaks down logs by type and source file, helping teams focus on what matters most during troubleshooting.
Executing JavaScript directly in the console
One of the console’s most practical features is the ability to execute JavaScript in real time. Developers can evaluate expressions, inspect objects, and modify the DOM on the fly. This makes it easy to test hypotheses, tweak styles, or validate logic without rebuilding or redeploying the application.
The console also stores a history of previously executed commands, allowing developers to quickly repeat or refine earlier experiments.
Inspecting difficult or transient UI elements
Some interface elements disappear as soon as developer tools are opened. By delaying execution or pausing scripts via the console, developers can freeze the page state and inspect otherwise inaccessible elements. This technique is especially useful for debugging hover-based menus or focus-driven UI components.
Working with execution contexts
Modern websites often rely on iframes, service workers, or browser extensions. Each of these runs in its own JavaScript context. The console allows developers to switch between contexts to ensure that commands execute in the correct environment and reference the intended DOM and global variables.
Advanced logging techniques
The console API supports far more than simple text output. Developers can log structured data, inspect objects interactively, format messages with styles, and generate stack traces on demand. Grouped logs help organize large volumes of information, while tables present arrays and objects in a readable format.
Timing utilities make it easy to measure execution duration, and counters help track how often specific actions occur during page interaction.
Console utilities that boost productivity
Special helper functions extend the console’s capabilities even further. Developers can reference selected DOM elements instantly, copy data directly to the clipboard, monitor function calls, track event listeners, and pause execution at critical moments.
These utilities reduce the need for temporary debug code and streamline investigation during both development and production debugging.
Performance profiling from the console
Performance analysis does not have to start in a separate tool. Developers can programmatically start and stop performance profiles directly from the console, capturing precisely the sections of code they want to analyze.
This approach provides tighter control over profiling sessions and avoids unnecessary noise in performance recordings.
Persisting logs and customizing console behavior
Console settings allow developers to preserve logs across page navigations and control which types of messages are displayed. This is particularly helpful when debugging issues that occur during redirects or application initialization.
By fine-tuning these settings, teams can tailor the console experience to match their debugging workflow.
Using external tools to review console output
While browser-based consoles are ideal for live debugging, external tools can capture console output for later review. Our excellent tool Browsershots.at goes beyond visual screenshots by also storing the full console output and the page source code. This allows users to inspect JavaScript logs, errors, and underlying markup even after the test has finished.
This capability is especially valuable for cross-browser testing, regression checks, and sharing detailed diagnostics with teammates or clients.
Why mastering the browser console matters
The browser console is more than a place to see error messages. It is a comprehensive debugging environment that supports experimentation, analysis, and performance optimization. Developers who invest time in learning its features gain faster feedback loops, deeper insight into application behavior, and greater confidence when diagnosing complex issues.
Combined with monitoring tools and browser testing platforms, the console becomes a cornerstone of reliable, high-quality web development.